PLANT_SURVIVAL_SYSTEM
Team Details
- Team Number: T13
- Team Name: DreamCatcher
- Team Members:
- Abhik Kumar
- Toma Yasuda
- GitHub Repository URL: LINK
- Website Link: LINK
- Node Red UI: LINK
Project Pics


Team DreamCatcher at Demo Day – showcasing their innovative plant monitoring system and receiving recognition for their work.
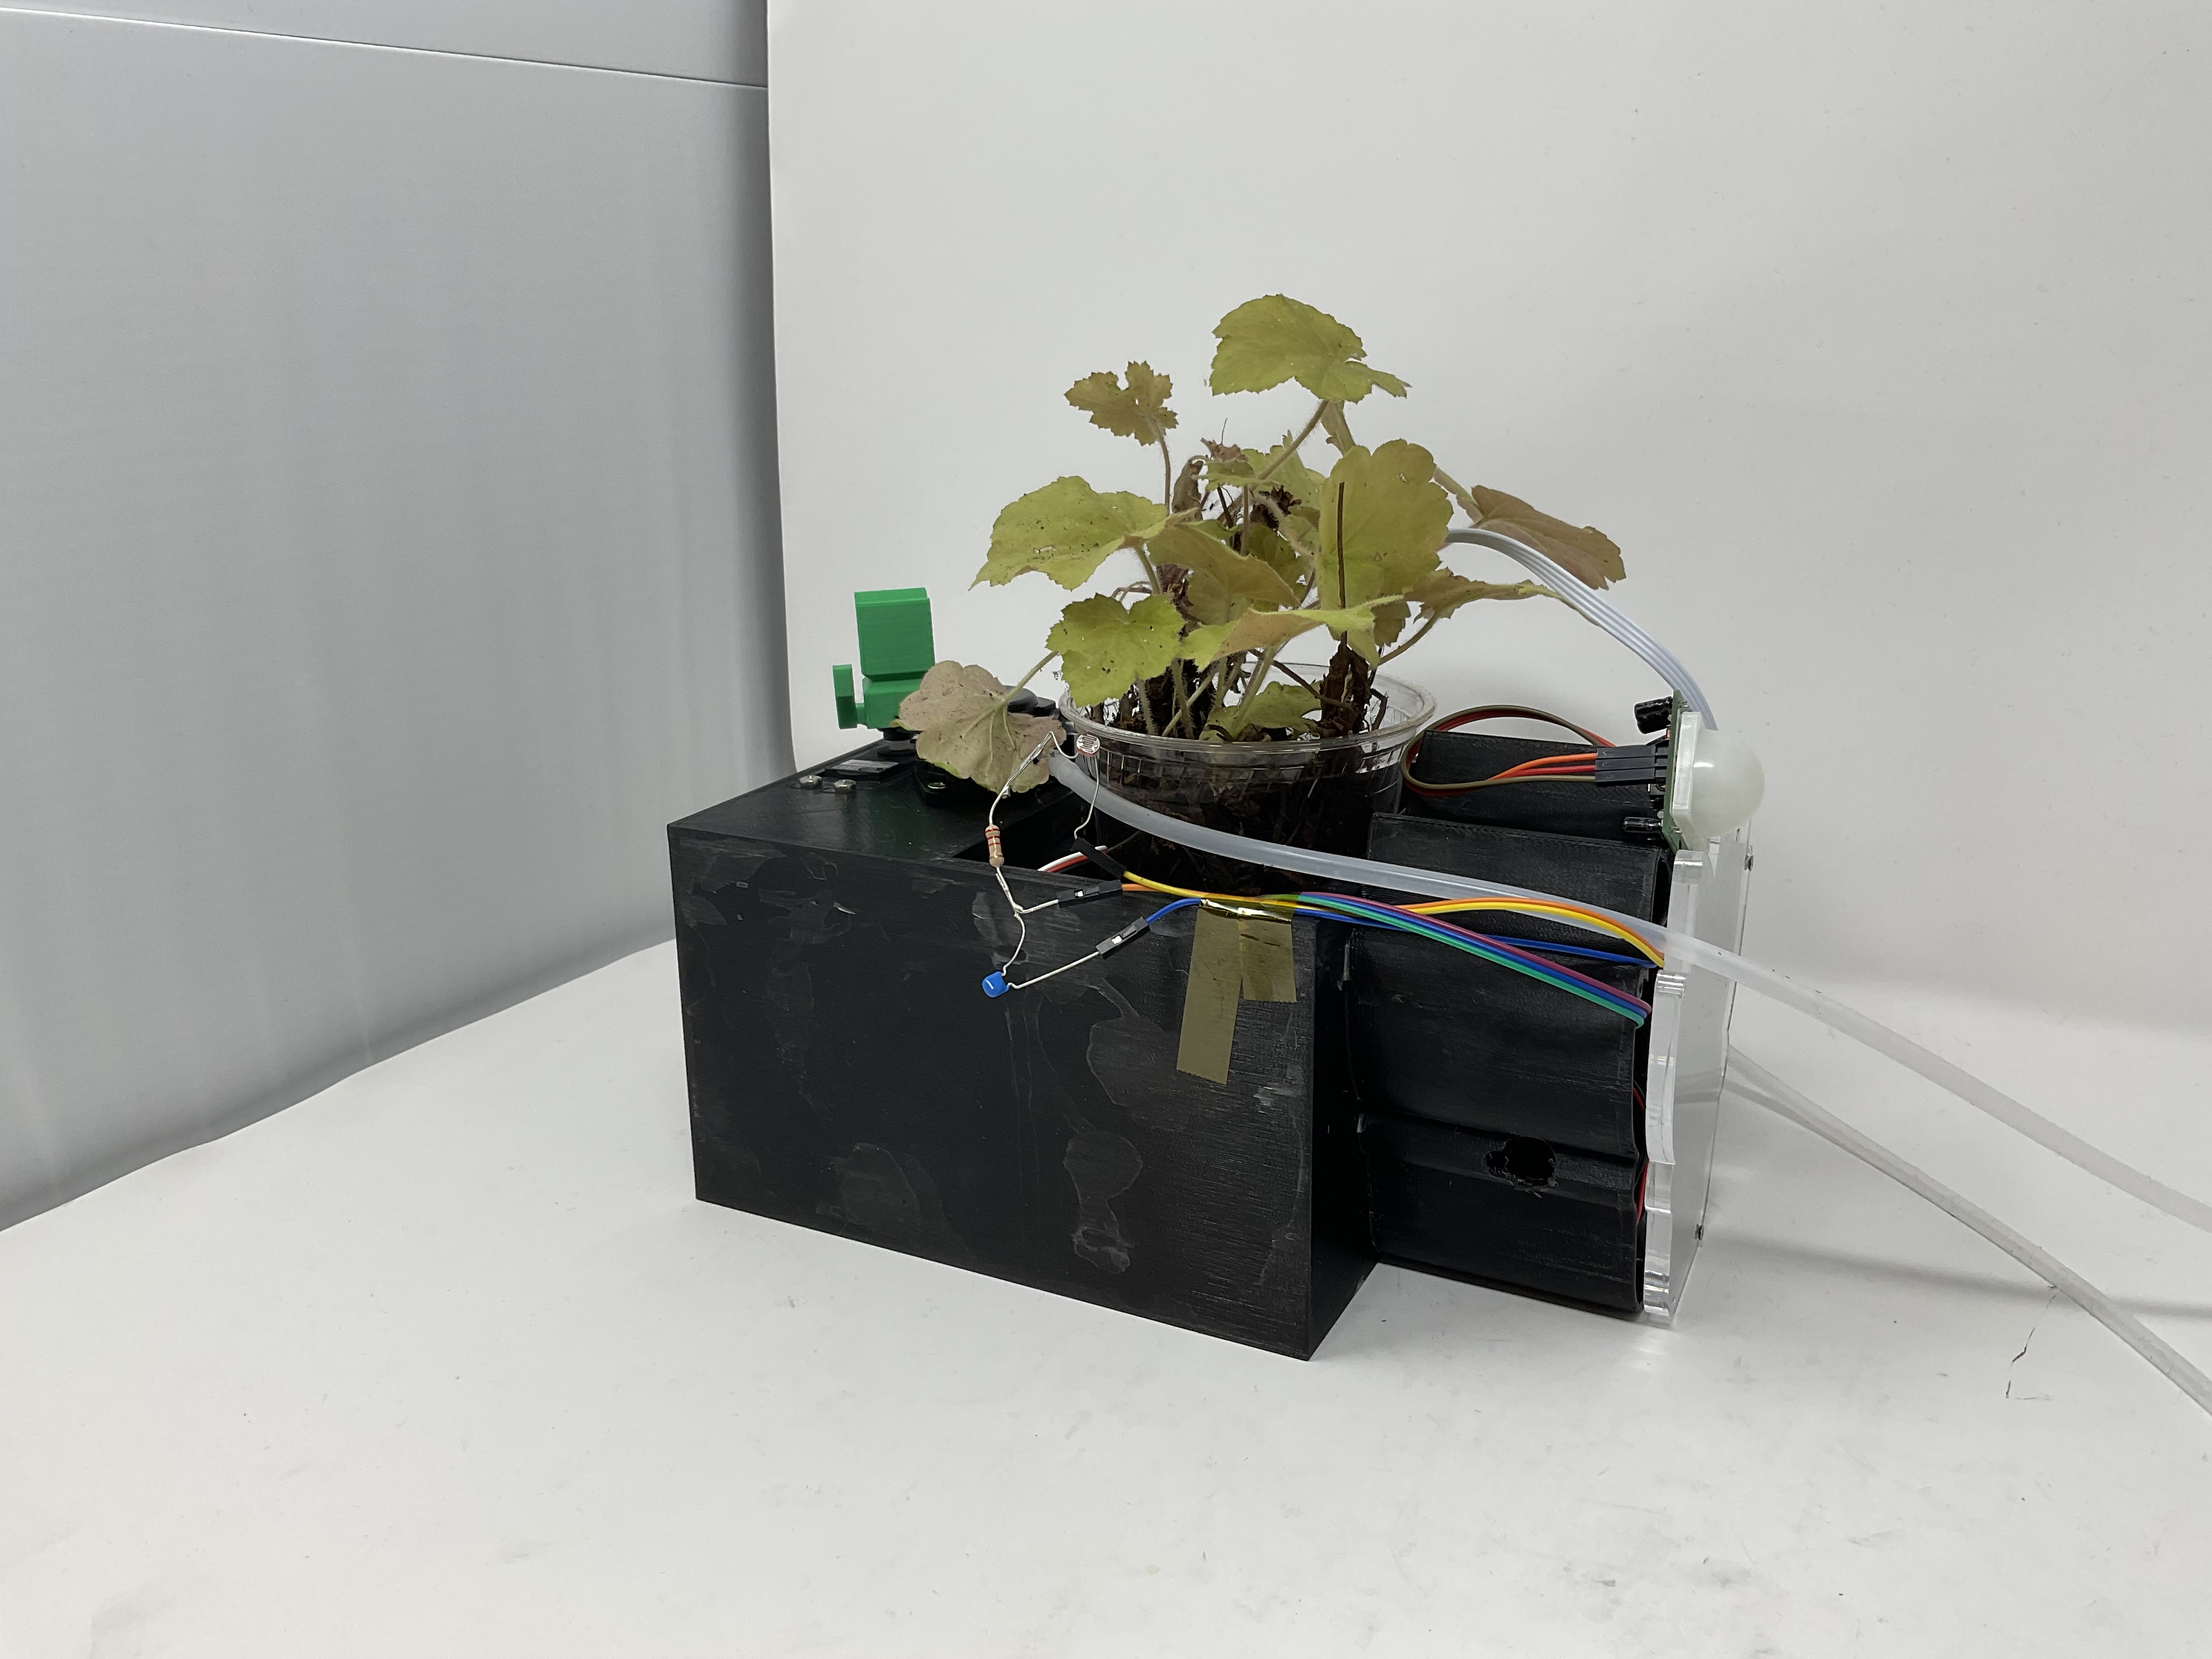


Hardware views of the plant monitoring system – highlighting sensor integration, compact design, and component layout from multiple angles.
1. Video Presentation
2. Project Summary
Device Description
The Plant Survival System is a real-time environmental sensing and response unit designed to automate plant care and provide rich telemetry via the Internet. Built on a SAMD21 microcontroller with FreeRTOS, it integrates sensors and actuators for smart irrigation, climate monitoring, and deterrence systems.
We were inspired by the lack of reliable, scalable, and low-power plant monitoring solutions suitable for both indoor and outdoor use. This device helps automate watering, air quality tracking, and soil nutrient monitoring — solving problems for both hobbyists and agriculture tech use cases.
How the Internet Augments Functionality
The system uses Wi-Fi (via the SAMW25 chip) to send live sensor data to a Node-RED dashboard, enabling real-time remote monitoring. It also supports Over-The-Air (OTA) updates and email notifications, expanding usability and eliminating the need for physical intervention. All key data (e.g., soil moisture, air quality, NPK) is visualized remotely, enabling data-driven plant care.
Device Functionality
The device architecture includes:
- Sensors:
- SHT4x (Temperature & Humidity via I2C)
- STEMMA Soil Sensor (Moisture & Temperature via I2C)
- SGP40 (Air Quality VOCs via I2C)
- Photoresistor (Analog input via ADC)
- PIR Motion Sensor (Digital input via GPIO interrupt)
- UART-based NPK Sensor via RS485
- Actuators:
- DC Water Pump (GPIO trigger)
- Fan (GPIO trigger)
- Buzzer (PWM via TCC2 on PA17)
- Servo-based Puppet (PWM via TCC0 on PA10)
- MCU Platform:
- SAMD21 Cortex-M0+ running FreeRTOS
- Node-RED UI hosted via Wi-Fi on SAMW25
Challenges
-
Firmware:
Integrating blocking UART-based sensors like the NPK required timeout-based non-blocking reads to prevent task starvation. -
Hardware:
Conflicts in timer and PWM channel assignments (TCC/TC) required a full mapping overhaul. We assigned unique TCC instances per actuator. -
Integration:
Debugging I2C bus stability involved using stronger pull-up resistors and reducing communication frequency to ensure reliability.
Prototype Learnings
- Plan all TCC and pin muxing early — same TCC can’t drive multiple wave outputs on separate pins without conflict.
- Ensure timeout-based UART drivers for all serial sensors — avoids blocking FreeRTOS tasks.
- Implement stack monitoring with
uxTaskGetStackHighWaterMarkto catch task crashes during integration. - For environmental sensors, keep airflow consistent using fans and avoid proximity to heat sources like regulators.
If we built it again:
- Use SAMD51 for more timers and memory
- Add BLE for smartphone pairing
- Use waterproof casings and modular connectors
Next Steps & Takeaways
- Integrate weather forecast APIs to override watering logic
- Add capacitive touch or push-button for manual override
- Switch to low-power sleep mode and use interrupts to wake up
- Extend Node-RED UI with user authentication and logging history
What We Learned in ESE5160
This course taught us complete embedded prototyping from hardware interfacing to cloud integration. We learned:
- FreeRTOS task scheduling and memory debugging
- Real-time sensor management using I2C, UART, and ADC
- Building asynchronous, non-blocking device drivers
- Using Node-RED for UI + MQTT for IoT data streams
- Designing reliable firmware and PCBs with Altium
Project Links
3. Hardware & Software Requirements
Hardware Requirements Specification (HRS)
Overview
The IoT Plant Monitoring System was developed for real-time plant health monitoring and management using a combination of sensors and actuators. The system was powered by the SAMW25 microcontroller, which provided integrated Wi-Fi communication for data sharing and supported peripherals for environmental monitoring and actuation.
The hardware integrated soil moisture sensors, temperature and humidity sensors, a light sensor, motion sensor, air quality sensor, and a soil NPK sensor. Actuators such as a water pump and motion deterrent system ensured automated responses. The system also featured a microSD card for efficient data logging.
Definitions and Abbreviations
- SAMW25: Microcontroller with integrated Wi-Fi
- RTOS: Real-Time Operating System
- Li-ion: Lithium-ion battery
Functional Requirements
-
HRS 01: The SAMW25 microcontroller shall be used for processing, Wi-Fi communication, and interfacing with peripherals via I2C, SPI, UART, and GPIO.
-
HRS 02: A capacitive soil moisture sensor shall be used to measure soil water content (±3% accuracy) via I2C and shall trigger a water pump when moisture drops below a capacitive value of 400.
-
HRS 03: An SHT4x sensor shall measure temperature and humidity with ±0.5°C and ±2% accuracy. It shall be used to monitor environmental conditions to support suitable plant care.
-
HRS 04: A photodiode-based light sensor shall be interfaced via ADC and shall detect lux levels (±2 lux). It shall assist in disabling certain sensors at night to save power.
-
HRS 05: A soil NPK sensor (via RS485 + UART) shall be used to measure nitrogen, phosphorus, and potassium levels. It shall require 5V, and the RS485 module shall be powered via a separate supply (3.3V or 5V depending on module rating).
-
HRS 06: A DC water pump (500 ml/min) shall be activated via GPIO based on soil moisture readings and shall adjust based on temperature and weather data.
-
HRS 07: A PIR motion sensor shall detect objects within a 50 cm radius and shall trigger a buzzer via GPIO for 5 seconds.
-
HRS 08: An RC filter shall be used to set the reference voltage of the ADC to a value suitable for the microcontroller and to reduce signal noise.
-
HRS 09: The system shall operate on a 3.7V 2500mAh Li-ion battery with buck and boost converters supplying 3.3V, 5V, and 12V rails.
-
HRS 10: A microSD card interfaced via SPI shall log sensor data and firmware images.
-
HRS 11: A PWM-controlled motor-driven puppet shall be activated on motion detection to deter animals.
-
HRS 12: Power and barrel connector LEDs shall be included to indicate system and power status.
-
HRS 13: An RS485 interface shall be used for the NPK sensor, powered by a 12V boost converter (or 5V depending on module requirements).
-
HRS 14: An SGP40 sensor shall be used to monitor VOC levels (0–1000 ppm) via I2C.
-
HRS 15: A 5V wall adapter shall be used to power high-current devices such as the pump and fan.
Validation of Hardware
| Hardware Requirements | Review |
|---|---|
| HRS 01 | Achieved. |
| HRS 02 | Achieved. |
| HRS 03 | Achieved. |
| HRS 04 | Achieved. |
| HRS 05 | Achieved. |
| HRS 06 | Not achieved. The water pump does not deliver 500 ml/min. The water pump only delivers approximately 100 ml/min, as specified in the datasheet. The feature to determine whether to water based on the forecasted weather was not implemented. |
| HRS 07 | Achieved. |
| HRS 08 | Achieved. |
| HRS 09 | Achieved. |
| HRS 10 | Achieved. Data collected by NPK sensor and other sensors was able to be stored in SD card. The firmware image was able to stored in SD card. |
| HRS 11 | Achieved. |
| HRS 12 | Achieved. |
| HRS 13 | Achieved. |
| HRS 14 | Achieved. |
| HRS 15 | Achieved. |
Software Requirements Specification (SRS)
Overview
The system software managed real-time sensor data collection, automated actuation, and remote monitoring through Wi-Fi. It was developed using FreeRTOS and integrated cloud support.
Definitions and Abbreviations
- Web Interface: Platform for user interaction and control
- Wi-Fi: Wireless communication protocol
- MQTT: Publish-subscribe based messaging protocol for communication
Functional Requirements
-
SRS 01: Sensor data shall be collected every 1 minute with ±1% sampling accuracy.
-
SRS 02: The system shall transmit real-time sensor data — including soil moisture, soil temperature, air temperature, humidity, air quality, light intensity, and NPK levels — to the cloud over Wi-Fi.
-
SRS 03: NPK levels shall be measured every minute. Alerts shall be sent via email when any nutrient value drops below its respective threshold.
-
SRS 04: The water pump shall activate when soil moisture drops below a capacitive value of 400 and shall turn off once the moisture reaches the predefined setpoint.
-
SRS 05: The PIR motion sensor shall trigger a buzzer, fan, and puppet deterrent for 5 seconds upon detecting motion. This response shall be overrideable via a user-controlled button.
-
SRS 06: The system shall support Over-The-Air (OTA) firmware updates initiated by a button click within the GUI.
-
SRS 07: The system shall send email notifications to inform users about critical conditions, such as temperature extremes or low soil nutrients.
-
SRS 08: Real-time and historical data shall be visualized through a web interface, which shall include graphs, trends, and live status indicators.
-
SRS 09: A microSD card shall log timestamped sensor data using a rolling buffer to manage storage efficiently. Data shall sync to the cloud when Wi-Fi connectivity is available.
-
SRS 10: The fan shall turn on automatically in response to motion detection or elevated temperature to ensure consistent airflow and accurate sensor readings.
Validation of Software
| Software Requirements | Review |
|---|---|
| SRS 01 | Achieved. All data were collected every 5 seconds and displayed on the serial terminal and Node-REsD dashboard. |
| SRS 02 | Achieved. All data were displayed on the Node-RED dashboard which is shown in the Node-RED dashboard images. |
| SRS 03 | Achieved. NPK level was measured every 5 seconds and stored in SD card. Email notification was sent when nutrient levels dropped as shown in video. |
| SRS 04 | Achieved. The water pump was activated when soil moisture measured below 400 capacitive value as shown in video. |
| SRS 05 | Not achieved. The PIR motion sensor activate a buzzer, fan, and servo for 5 seconds. However, the button to stop the motion deterrent system was not implemented. To tackle this we used a shade to block the motion sensor filed of view. |
| SRS 06 | Achieved. The firmware update and gold image copying were initiated via buttons on the Node-RED dashboard. |
| SRS 07 | Achieved. An email notification was successfully sent to the address entered by the user in Node-RED when a critical condition occurred. |
| SRS 08 | Achieved. The real-time data from the sensors were displayed on gauges on website. The historical data were displayed on line charts. The LED indicates system status of actuators. |
| SRS 09 | Not achieved. Data collected by NPK sensor and other sensors was able to be stored in SD card. Data synced with cloud functionality when Wi-Fi was not implemented |
| SRS 10 | Achieved. The fan was activated when motion was detected by motion sensor. The status of the fan is whether on or off is displayed on the Node-RED dashboard. |
4. Project Photos & Screenshots
3D Model for Case


The Altium Board design in 2D view


The Altium Board design in 3D view


Design-to-hardware pipeline – starting with vector outlines in Adobe Illustrator, imported into SolidWorks for 3D modeling, then integrated into Altium Designer to finalize the board shape and electrical layout.
The standalone PCBA


Manufactured PCBAs – final assembled boards from our custom design, ready for integration and testing.
Thermal camera images while the board is running under load


System under load testing – validating sensor stability, power management, and communication reliability under operational conditions.
External sensor


External NPK sensor (UART, Model: DFROBOT SEN-0462) and soil moisture & humidity sensor (I2C, Model: Stemma) were used to monitor soil health while keeping the main board safe from moisture and corrosion.
Node-RED Dashboard:
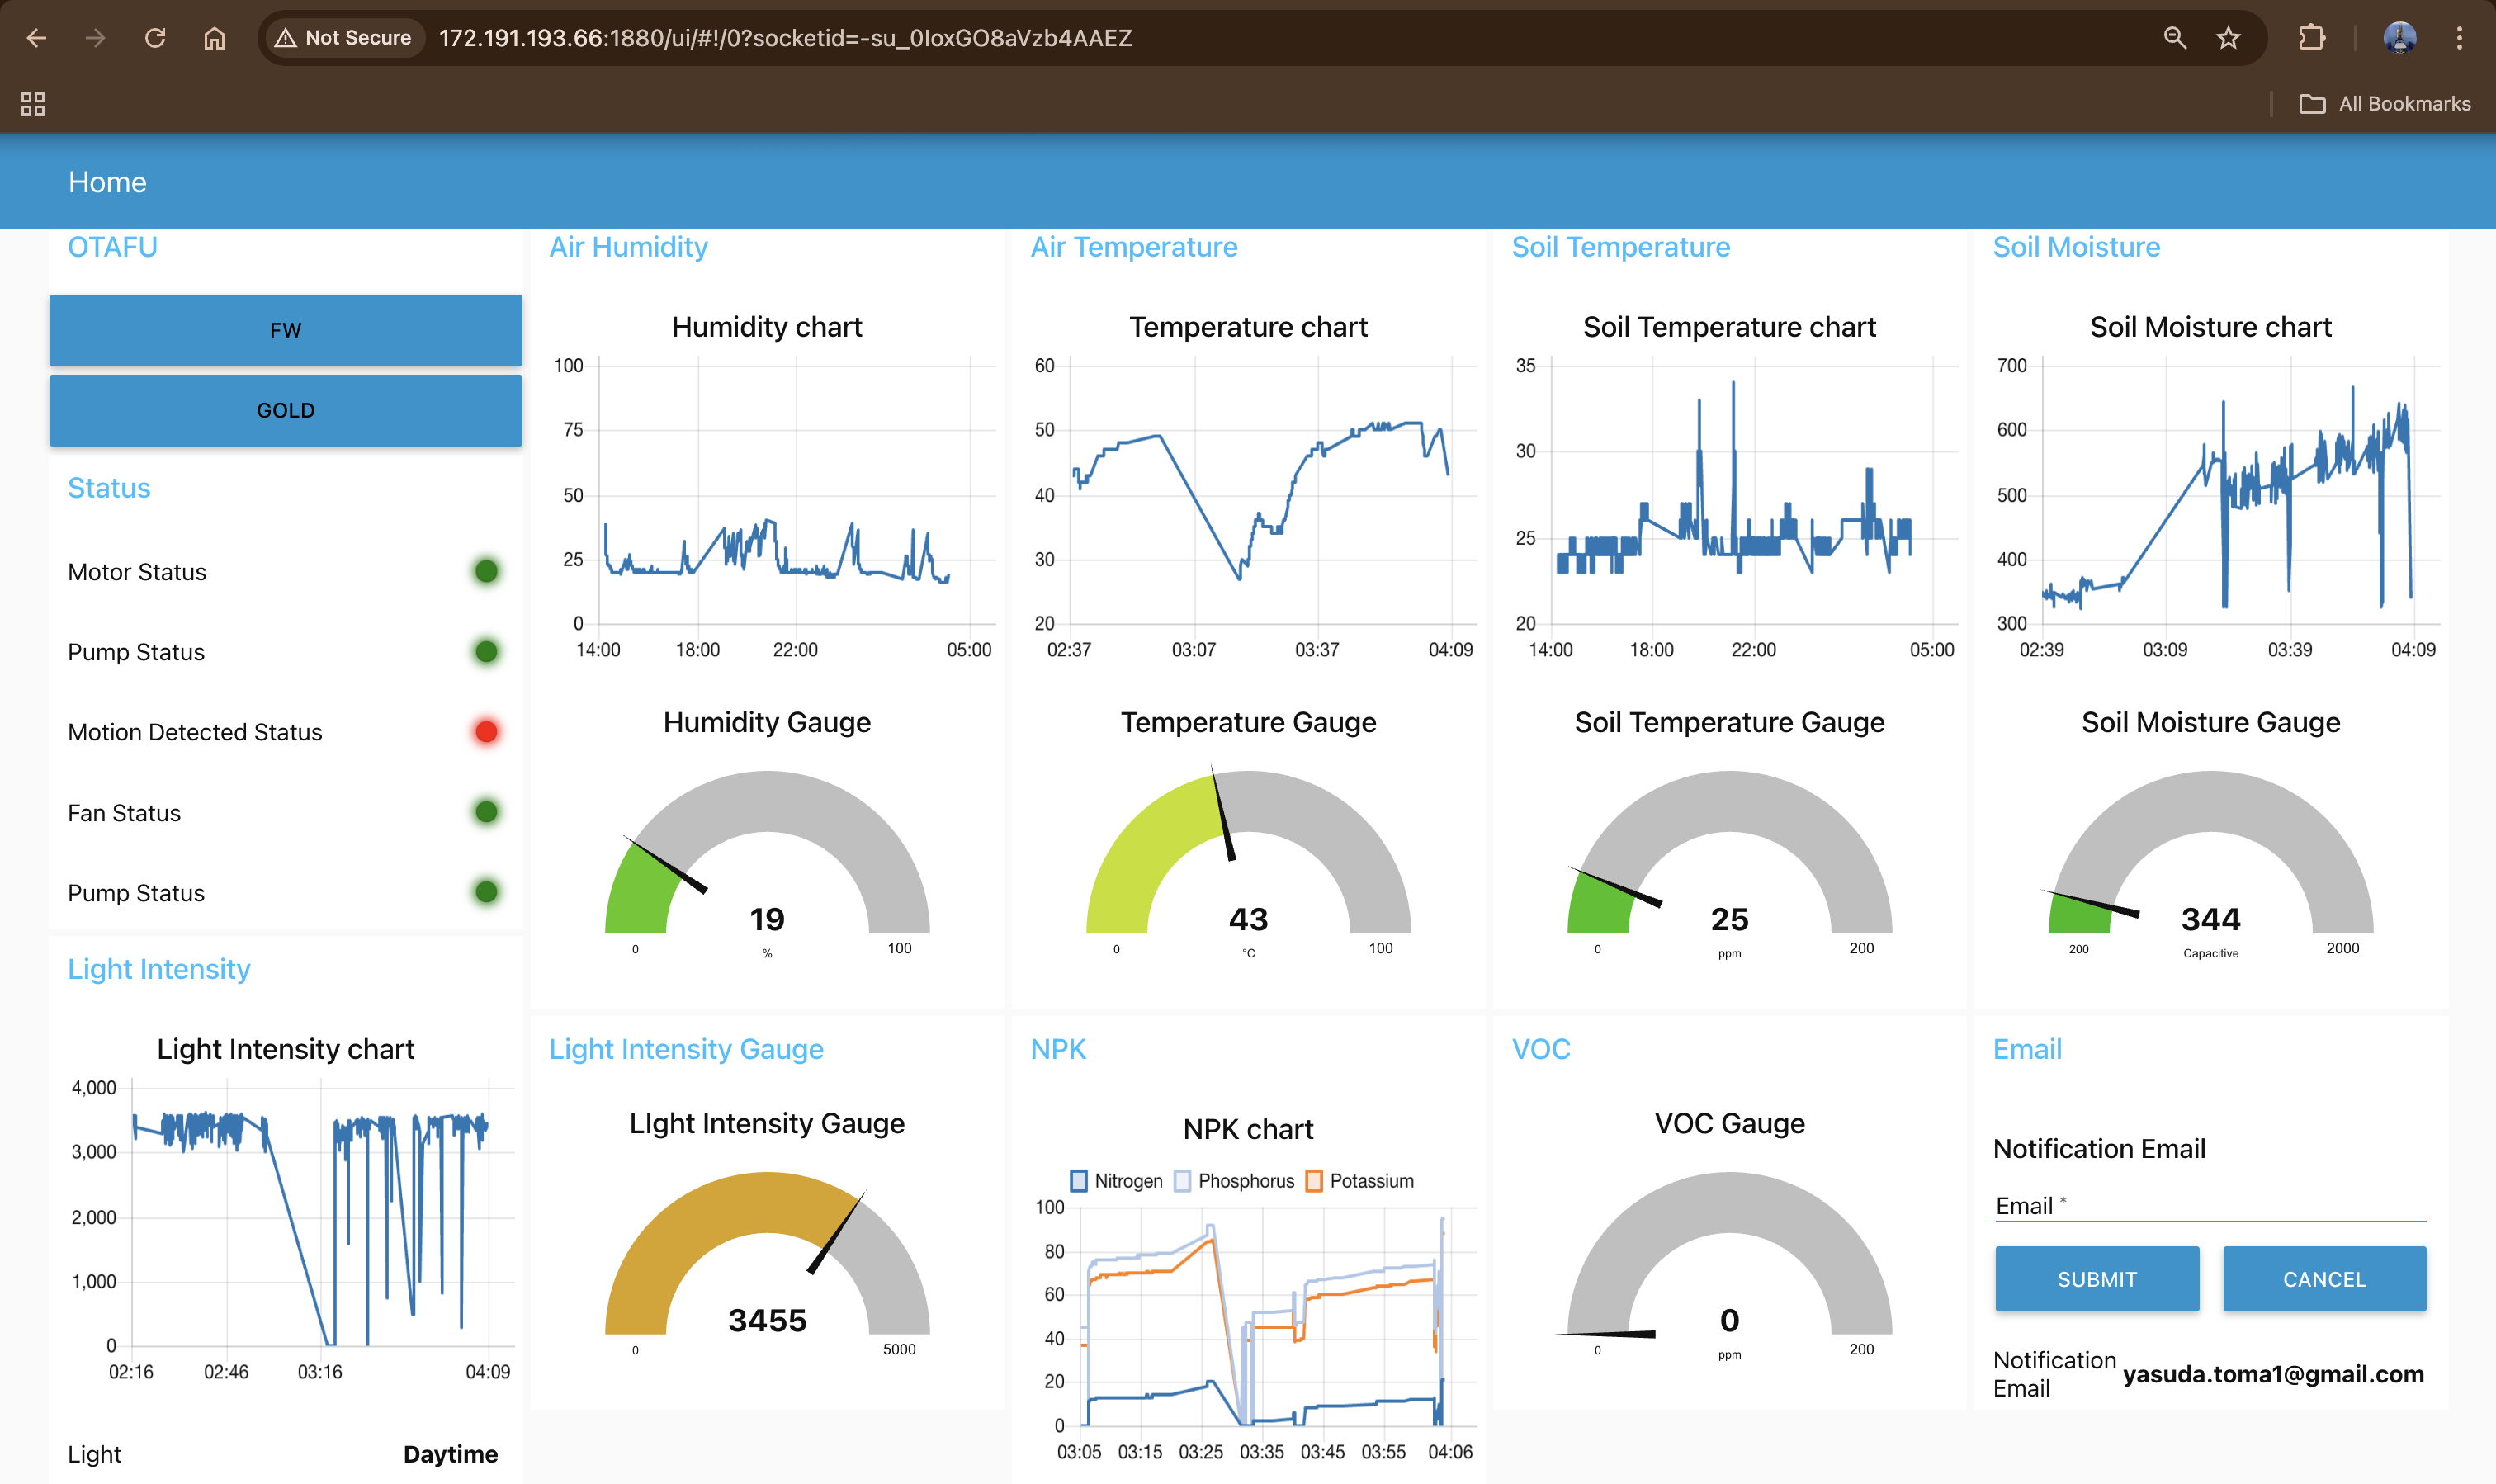
Node-RED Dashboard – visualizing real-time sensor data and system control interface for the plant monitoring application.
Node-RED Backend:
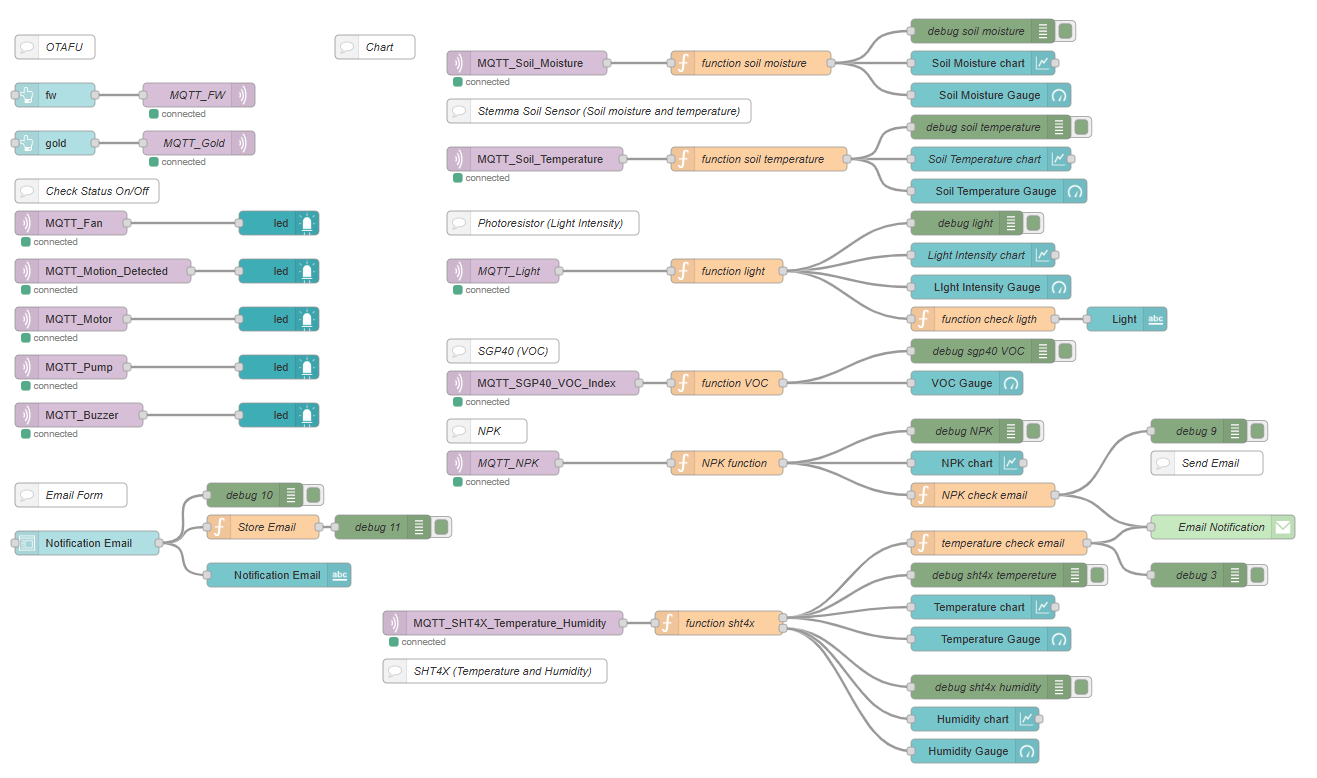
Node-RED backend dashboard – featuring real-time visualization, control logic, and wireless data monitoring interface.
Block diagram of the system:
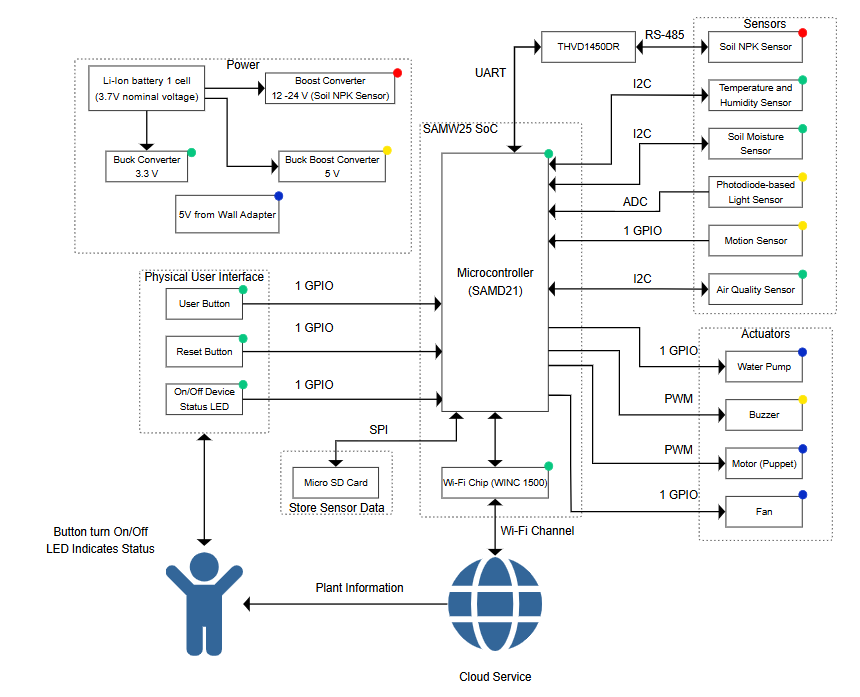
Comprehensive system diagram – illustrating the functional flow of data between sensors, microcontroller, communication modules, and cloud interface, along with power distribution showing how each component is powered within the plant monitoring setup.
5. Codebase
-
Embedded C firmware: LINK
-
Node-RED Flow: LINK
-
Node-RED dashboard code:LINK
-
Altium Design: LINK
-
BOM: LINK
-
Additional Tools:
- Microchip Studio for development
- Python scripts were used to update the Wi-Fi driver
- VS code for code search and navigation
- Saleae Logic Analyzer for waveform analysis
- Lab Oscilloscope and power supply for testing
- Custom queue manager for data handling
- UART timeout-based reading logic for NPK
- PWM duty-cycle tuning routines for buzzer and fan
Task Breakdown
| Task | Description |
|---|---|
| SPI TASK | SD Card communication |
| I2C Task | SHT4x, Soil Sensor, SGP40 polling |
| ADC Task | Photoresistor peak sampling |
| UART Task | NPK sensor polling with timeout protection |
| Motion Handler Task | Interrupt-based motion activation + actuation |
| Schedule Task | Aggregates all sensors and manages pump logic |
Notes
- Buzzer is driven using TCC2 on PA17
- Servo Motor is driven by TCC1 on PA10
- Pump uses GPIO to toggle ON and OFF
- Fan uses GPIO to toggle ON and OFF
- Non-blocking UART and I2C communication used wherever applicable
- All sensor values are debug-printed to serial terminal
- All I2C sensors were grouped to reduce the number of task
- Status of all the Actuators were displayed in Node-red
- NPK sensor can operates at 5V and the power supply for that might need to be separate than the RS485 (If RS485 is 3.3 V) {No need of 12 V}
- Same TCC doesn’t work on multiple pins.
- MCU Internal reference voltage is not 3.3v, so using ADC narrows the resolution.