a14g-final-submission-t02-you-penn-engine-ears

a14g-final-submission
* Team Number: 2
* Team Name: You Pen Engine Ears
* Team Members: Jack Campanella and Shreya Maggo
* Github Repository URL: https://github.com/ese5160/a14g-final-submission-t02-you-penn-engine-ears
* Description of test hardware: Custom PCBA, oscilloscope, DC power supply, electronic load, thermal camera, light box, comptuer (Altium Designer), soldering iron, probes, extra cables
1. Video Presentation
2. Project Summary
Device Description
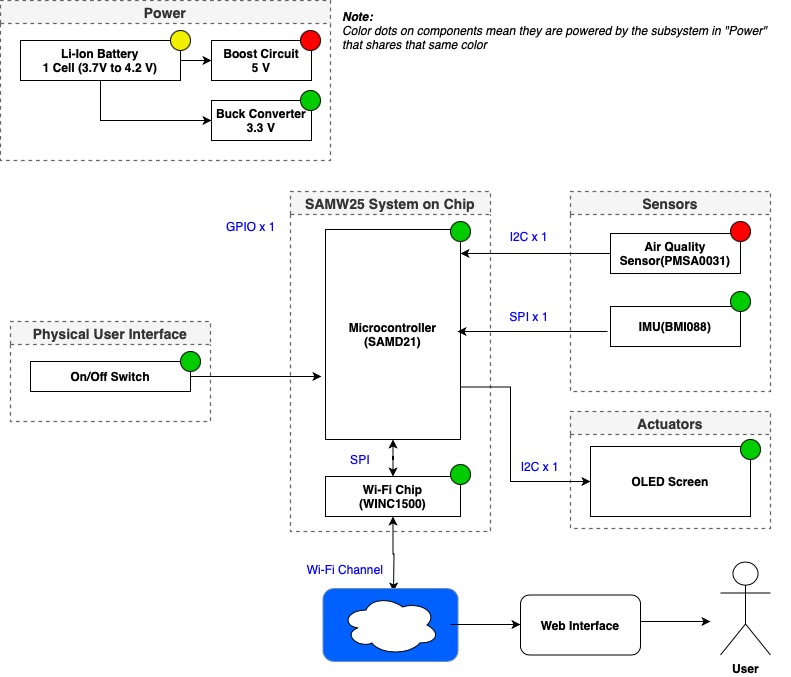
The robot sensing module uses the SAMW25 as its main microcontroller and connect the robot to the Internet of Things. This is intended to be an onboard feature for the sensing module as it can retrofit a larger number of robots as well as be used in other sensing applications such as being mounted to an emergency vehicle like an ambulance or fire truck. The module can be used to sense the air quality at its location and upload the data to the cloud in real time to inform first responders of safety conditions. This module can be deployed autonomously or manually as it operates independently of its method of transport and exists as a node in the Internet of Things network.
Inspiration
Local emergencies such as fires and construction site accidents with dust and debris are dangerous even for first responders. This device is useful to protect first responders when arriving on the scene of an emergency such as a building fire or building collapse to account for environmental conditions to prepare the responders for entering a dangerous area. The module can also be used to move away from a disaster or emergency by measuring the air quality to determine the area of evacuation in real time which can be useful for responding to disasters such as wildfires that occur near residential areas. As this information is available in real time in the cloud, it will be obtained faster than if humans moved through the environment if attached to a robot such as a quadrotor and allow for data to be aggregated from multiple modules in the cloud to quickly develop a safe response plan. # Device Functionality
The module includes a BMI088 IMU which includes a gyroscope and accelerometer that can be leveraged to determine the orientation and relative position of the robot. Another sensor is the PMSA0031 which is an air quality sensor capable of measuring the particle count from debris, smoke, and other particles. The actuator for the module is a Monochrome 1.3” 128x64 OLED graphic display to show the current module status such as battery, current operation, and display basic information about the data being gathered.
The robot sensing module will feature an intuitive User Interface (UI) designed to enhance the capabilities of the system. This UI will serve as a crucial tool for first responders and operators, providing real-time data visualization and user-friendly interaction. The UI will include features such as a real-time mapping system highlighting unsafe zones, prominently displayed temperature readings, and detailed air quality sensor data, including particle count from debris, smoke, and other airborne particles. Users have the flexibility to access a comprehensive map, detailed sensor readings, and a dashboard for holistic situational awareness.
# ChallengesFor the PCB the board layout was a particular challenge due to space constraints regarding many of the traces that included the SPI bus. This was challening due to the IMU containing two sensors, the gyroscope and accelerometer, a separate breakout for the OLED screen, and an I2C breakout for the Air Quality sensor. This was overcome by trying a few higher level layouts that filled in the supporting components and general traces around the connectors and IMU. As this developed the entire grouping of traces and supporting components close to the connectors and IMU were moved around the SAMD21 microcontroller until the design made sense and could fit into a logical spot on the PCB.
The traces connecting the I2C SDA and SCL lines to +5V had to be cut in order to connect them to +3.3V. Fortunately, cutting one trace sufficed.
Designing the heat map was a challenge as it required collecting data from the IMU and air quality sensor. Since the air quality sensor has not been integrated yet, I simulated the air quality sensor values. Forming a linear relation from the x and y readings to map the air quality sensors, using JavaScript to implement this functionality was a great learning experience.
# Prototype Lessons LearnedWhile the board benefits in its hardware design from using a shared SPI bus, this did make programming a little more challenging for trying to test peripherals. Future implementations and prototypes can be made better by separating the hardware for communication protocols as well to not share buses as this would help with programming and testing them during bring up and can always be revised in a second version or second prototype after confirming functionality.
After learning and practicing implementing drivers with RTOS through the use of FreeRTOS, future code for drivers can benefit from starting with a FreeRTOS implementation to save time and make it easier to integrate into a system or prototype that leverages FreeRTOS.
The use of multiple jumpers is not something that was previously encountered in PCB design despite it being on some previously used breakout boards. This is an extremely useful design approach along with testpoints to allow for verification and validation on prototypes as well as enabling possible modifications needed to be made due to small errors such as pulling up the I2C bus to 5V when it should be pulled up to 3.3V.
# TakeawaysOne of the critical takeaways from lectures was how FreeRTOS facilitates multitasking, allowing the development of complex embedded applications that can perform multiple functions concurrently without failing to meet real-time requirements.
Assignments were particularly instrumental in reinforcing these concepts. They offered hands-on experience with FreeRTOS, giving a deeper insight into tasks, queues, and other synchronization techniques. This practical application aided in understanding how to optimize the implementation and manage task priorities, which are vital for maintaining system stability and efficiency.
The lectures and assignments emphasized the use of development tools like the Command Line Interface (CLI), which proved essential for streamlining the development process. Learning to use the CLI efficiently allowed for faster iteration and debugging, which helped for testing the Hardware and Software requirements and in the general board bring up.
It was also helpful to go through how to design components from scratch in Altium based on datasheet specifications. This through line of leveraging datasheets throughout the course was also a great reminder in the design process.
# Project LinksNode-RED Instance:
A12G Code Repository: https://github.com/ese5160/a12g-firmware-drivers-t02-you-penn-engine-ears
Altium 365 PCBA: https://upenn-eselabs.365.altium.com/designs/4E715F27-C01E-4577-BB2F-23F5CDC1C921
## 3. Hardware & Software Requirements # Hardware Requirement Specifications |Req ID|Description| |------|------| |HRS 01|The project shall be based on the SAMW25 module| |HRS 02|The SAMD21 shall be the main microcontroller| |HRS 03|The WINC1500 shall be the WiFi chip| |HRS 04|The BMI088 shall be used as the IMU| |HRS 05|The accelerometer shall detect acceleration of the robot with a resolution of 0.09mg| |HRS 06|The gyroscope shall detect motion along three orthogonal axes with a resolution of 0.004°/s| |HRS 07|The IMU shall communicate with the microcontroller via SPI bus| |HRS 08|The PMSA0031 shall be used as the air quality sensor| |HRS 09|The air quality sensor shall communicate with the microcontroller via I2C bus| |HRS 10|The air quality sensor shall categorize particulate matter into various size bins: 0.3 micrometers, 0.5 micrometers, 1.0 micrometers, 2.5 micrometers, 5.0 micrometers, and 10 micrometers| |HRS 11|The air quality sensor shall measure concentration of particulate matter with diameters of 1.0 micrometers, 2.5 micrometers, and 10.0 micrometers| |HRS 12|The OLED screen shall be used for user interface| |HRS 13|The screen shall communicate with the microcontroller via I2C bus| |HRS 14|The screen shall display battery life| |HRS 15|The screen shall display number of suspended particles| |HRS 16|The system shall have an ON/OFF switch| # Implemented and Tested:HRS 01: The project was successfully based on the SAMW25 module as specified in the PCBA.
HRS 02: The SAMD21 was implemented as the main microcontroller as specified in the PCBA.
HRS 03: The WINC1500 was used as the WiFi chip as specified in the PCBA.
HRS 05: The accelerometer detected acceleration of the robot with a resolution of 0.09mg as tested with the CLI.
HRS 06: The gyroscope detected motion along three orthogonal axes with a resolution of 0.004°/s as tested with the CLI.
HRS 08: The PMSA0031 was used as the air quality sensor as specified in the PCBA.
HRS 12: The OLED screen was used for the user interface as specified in the PCBA.
HRS 13: The screen communicated with the microcontroller via the I2C bus with a modified solder connection.
# Implemented and Tested with Changes:HRS 04: The BMI088 was not fully implemented as the IMU and the LSM6DS0 was used instead.
HRS 07: The IMU did not communicate with the microcontroller via the SPI bus but instead an I2C bus was used.
HRS 13: The screen communicated with the microcontroller via the I2C bus.
# Not Implemented or Not Working:HRS 09: The air quality sensor did communicate with the microcontroller via the I2C bus but would only send 1 message with data.
HRS 10: The air quality sensor did not categorize particulate matter into various size bins as specified: 0.3 micrometers, 0.5 micrometers, 1.0 micrometers, 2.5 micrometers, 5.0 micrometers, and 10 micrometers based on how it sense particles, but this data was not all accessed.
HRS 11: The air quality sensor did measure the concentration of particulate matter with diameters of 1.0 micrometers, 2.5 micrometers, and 10.0 micrometers but was not confirmed beyond specification.
HRS 12: An OLED screen was used for the user interface.
HRS 14: The screen did not display the battery life.
HRS 15: The screen did not display the number of suspended particles.
HRS 16: The system shall have an ON/OFF switch
# Software Requirement Specifications |Req ID|Description| |------|------| |SRS 01|The sampling rate of the air quality sensor shall be variable as in active mode, there is stable and fast mode. If the concentration change of particles is small, the sensor shall be in stable mode and read in intervals of 2.3s and if the concentration change is big the sensor shall be in fast mode automatically and read in intervals of 200ms to 800ms with a higher concentration leading to a shorter interval| |SRS 02|The data from the air quality sensor shall be deemed accurate after a 30 seconds start up period for its fan| |SRS 03|The UI shall have a color coded map showing unsafe areas utilizing a color gradient for intensity| |SRS 04|The SAMD21 shall use a RTOS to switch between the different tasks for sensing and transmitting data| |SRS 05|The WINC1500 shall transmit air quality, gyroscope, and accelerometer data to the cloud every 15 +/-2 seconds| |SRS 06|The SAMD21 shall use separate SPI buses for the accelerometer and gyroscope| |SRS 07|The samples from the air quality sensor shall be averaged to improve accuracy| |SRS 08|The OLED screen shall display limited data of the orientation accurate to at least 2 decimal places and data related to air quality accurate to 2 decimal places| |SRS 09|The OLED screen shall display relative battery percentage using a conservative estimate that underestimates the amount of power left by at least 20%| |SRS 10|The OLED screen shall display WiFi connection and strength using “WiFi bars”| |SRS 11|The output data rate of the gyroscope and accelerometer in the IMU shall be 400Hz to synchronize the data| # Implemented and Tested:SRS 02: The data from the air quality sensor was deemed accurate after a 30 second startup period for its fan as required. This was a specification that was accepted as true based on the datasheet and testing the measurements with the CLI.
SRS 03: The UI successfully implemented a color-coded map showing unsafe areas, utilizing a color gradient for intensity. This was shown in the heatmap with Node Red.
SRS 04: The SAMD21 used a Real-Time Operating System (RTOS) to switch between different tasks for sensing and transmitting data as specified. This was tested by switching between tasks to upload data to the cloud and measuring with the IMU in the full demo.
SRS 08: The OLED screen displayed limited data on the orientation accurate to at least 2 decimal places and data related to air quality accurate to 2 decimal places as required.
SRS 11: The output data rate of the gyroscope and accelerometer in the IMU was set to 400Hz, successfully synchronizing the data as specified. This was specified in the code and tested to be robust by commanding the IMU to remeasure it's data.
# Implemented and Tested with Changes:SRS 05: The WINC1500 did transmit the, gyroscope and accelerometer data to the cloud every 15 seconds with a tolerance of +/-2 seconds as required but did not transmit the air quality data. The air quality data was not obtained to transmit to the cloud.
SRS 06: The SAMD21 did not use separate SPI buses for the accelerometer and gyroscope in the software as it was switched to be implemented on an I2C bus.
# Not Implemented or Not Working:SRS 01: The air quality sensor did not have a variable sampling rate as specified. It failed to switch between stable mode with intervals of 2.3 seconds and fast mode with intervals between 200ms to 800ms depending on the particle concentration changes. This was not implemented.
SRS 07: The samples from the air quality sensor were not averaged to improve accuracy, fulfilling the requirement because only one data reading was obtained.
SRS 09: The OLED screen did not display the relative battery percentage using a conservative estimate that underestimates the amount of power left by at least 20% because it was not able to be implemented.
SRS 10: The OLED screen did not display WiFi connection strength using “WiFi bars” as required because it was not able to be implemented. ## 4. Project Photos & Screenshots # Final Project: # PCBA Top: 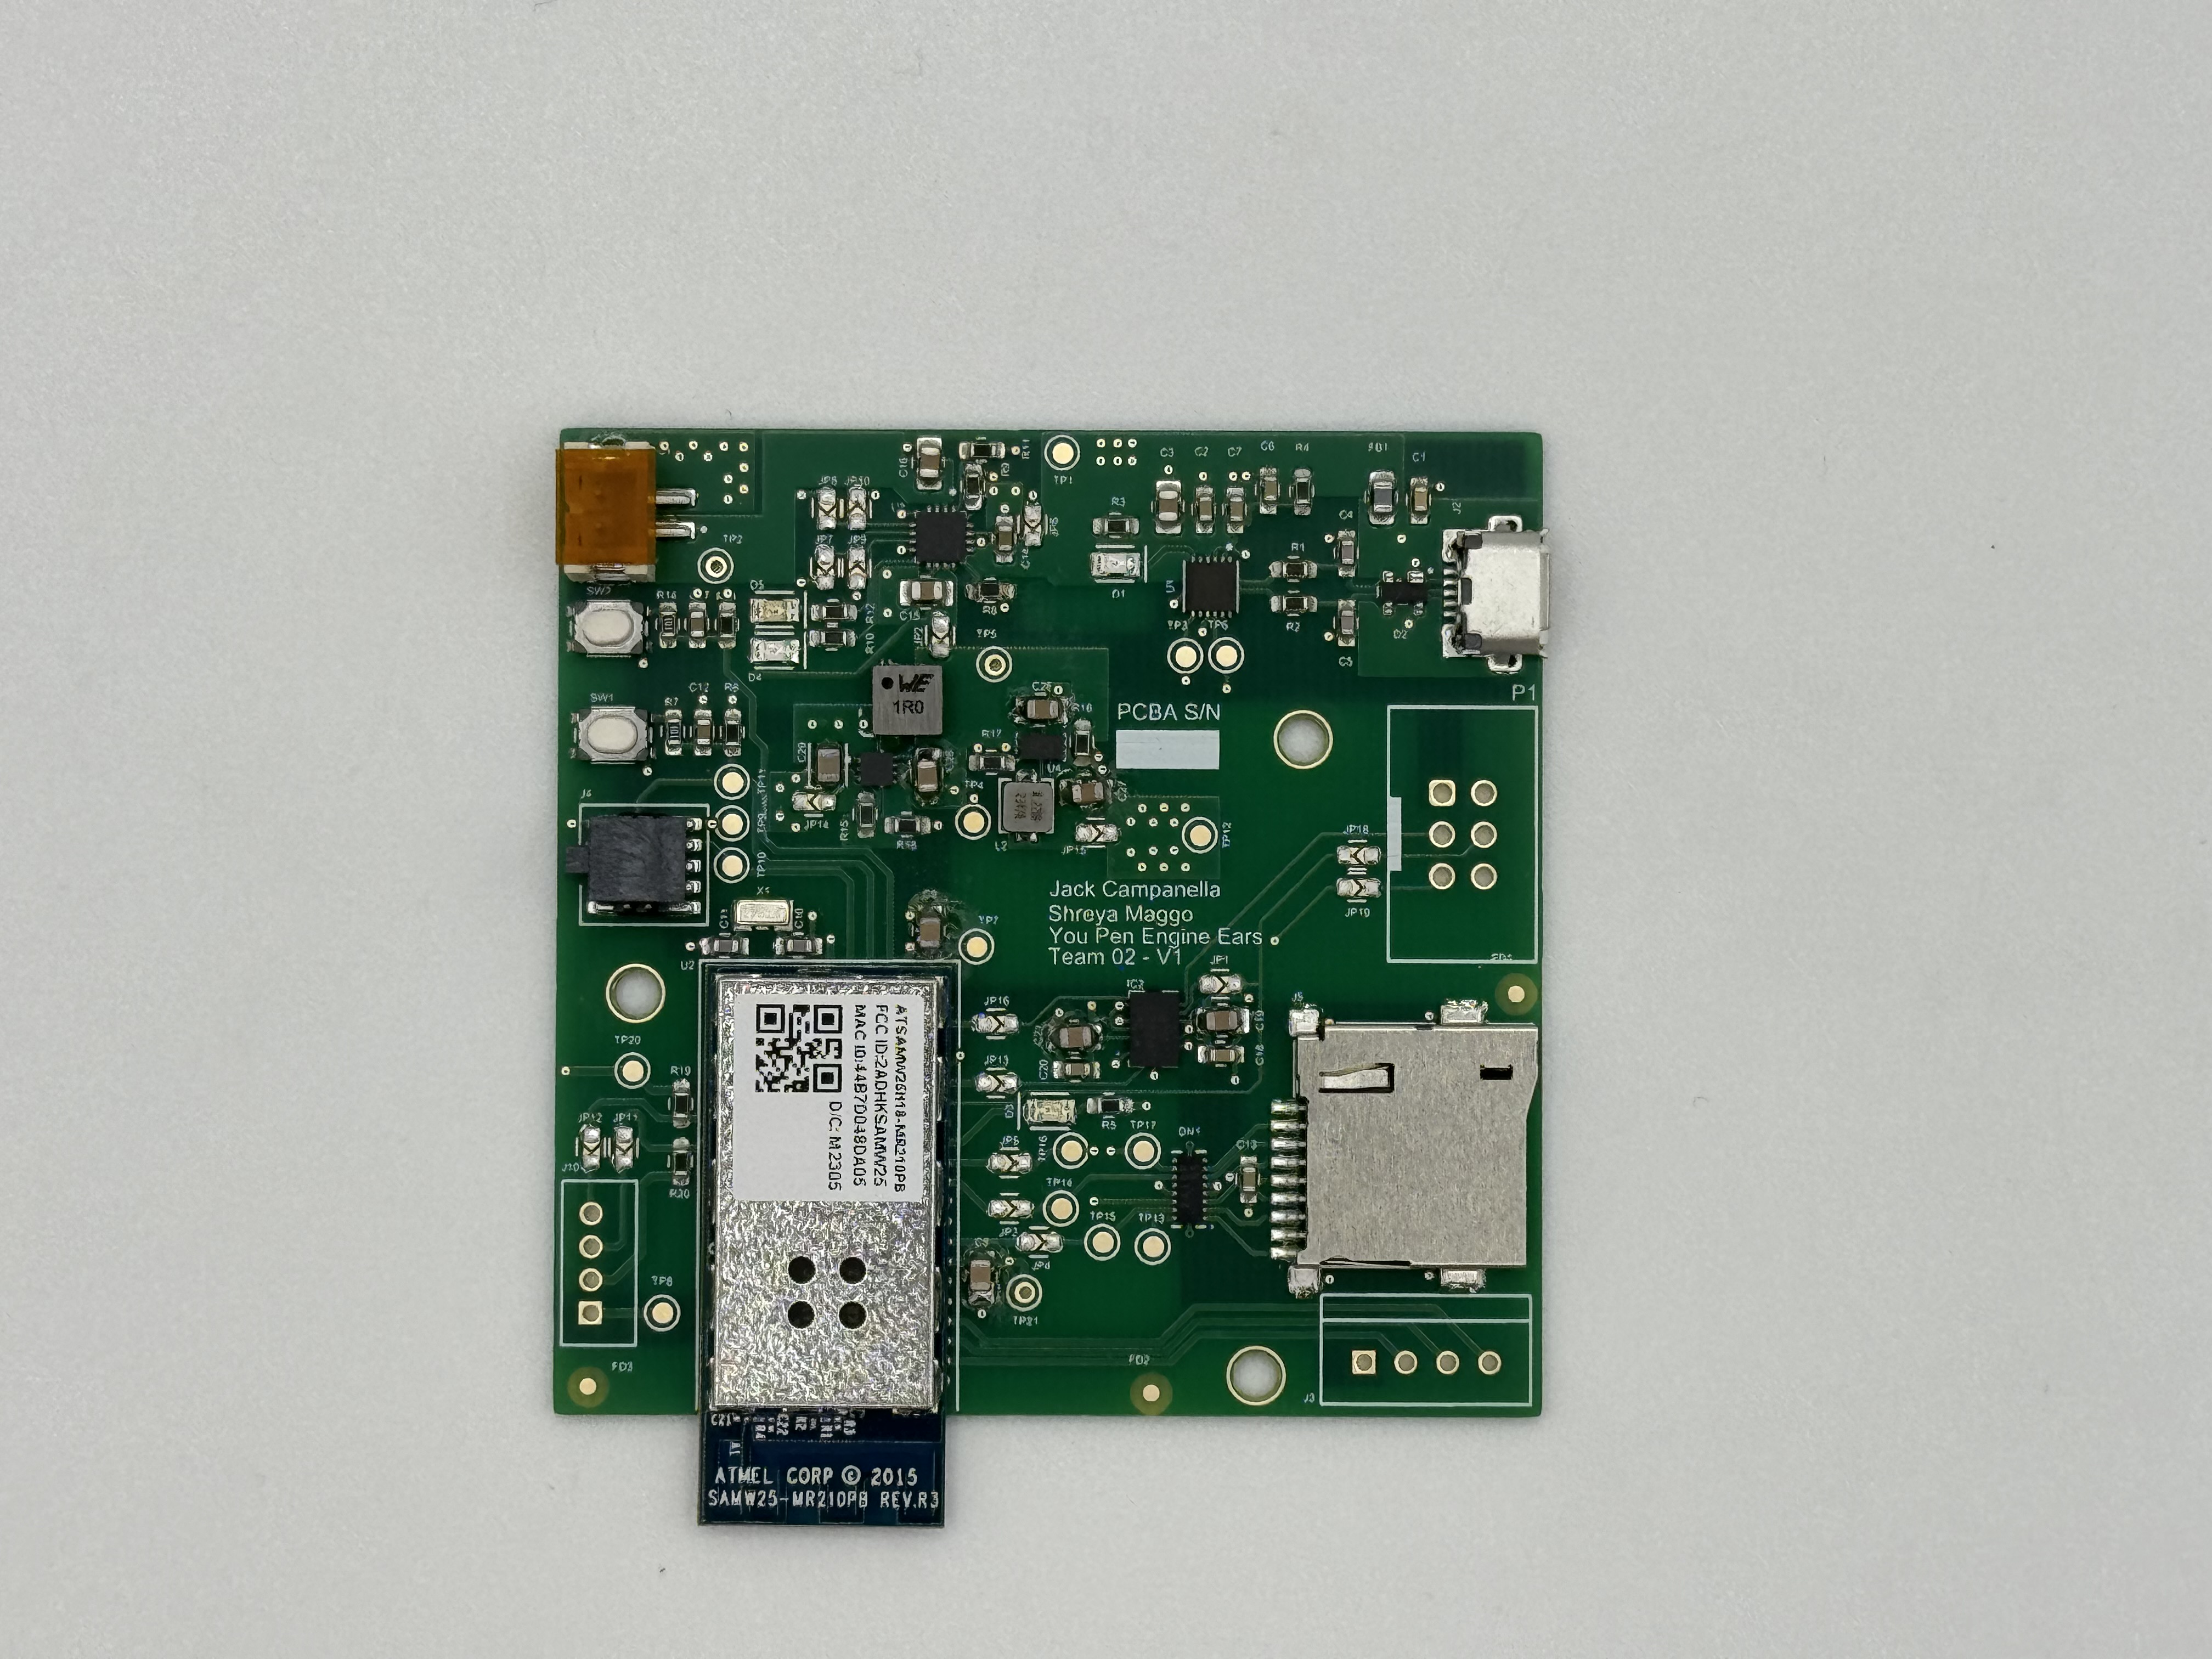 # PCBA Bottom: 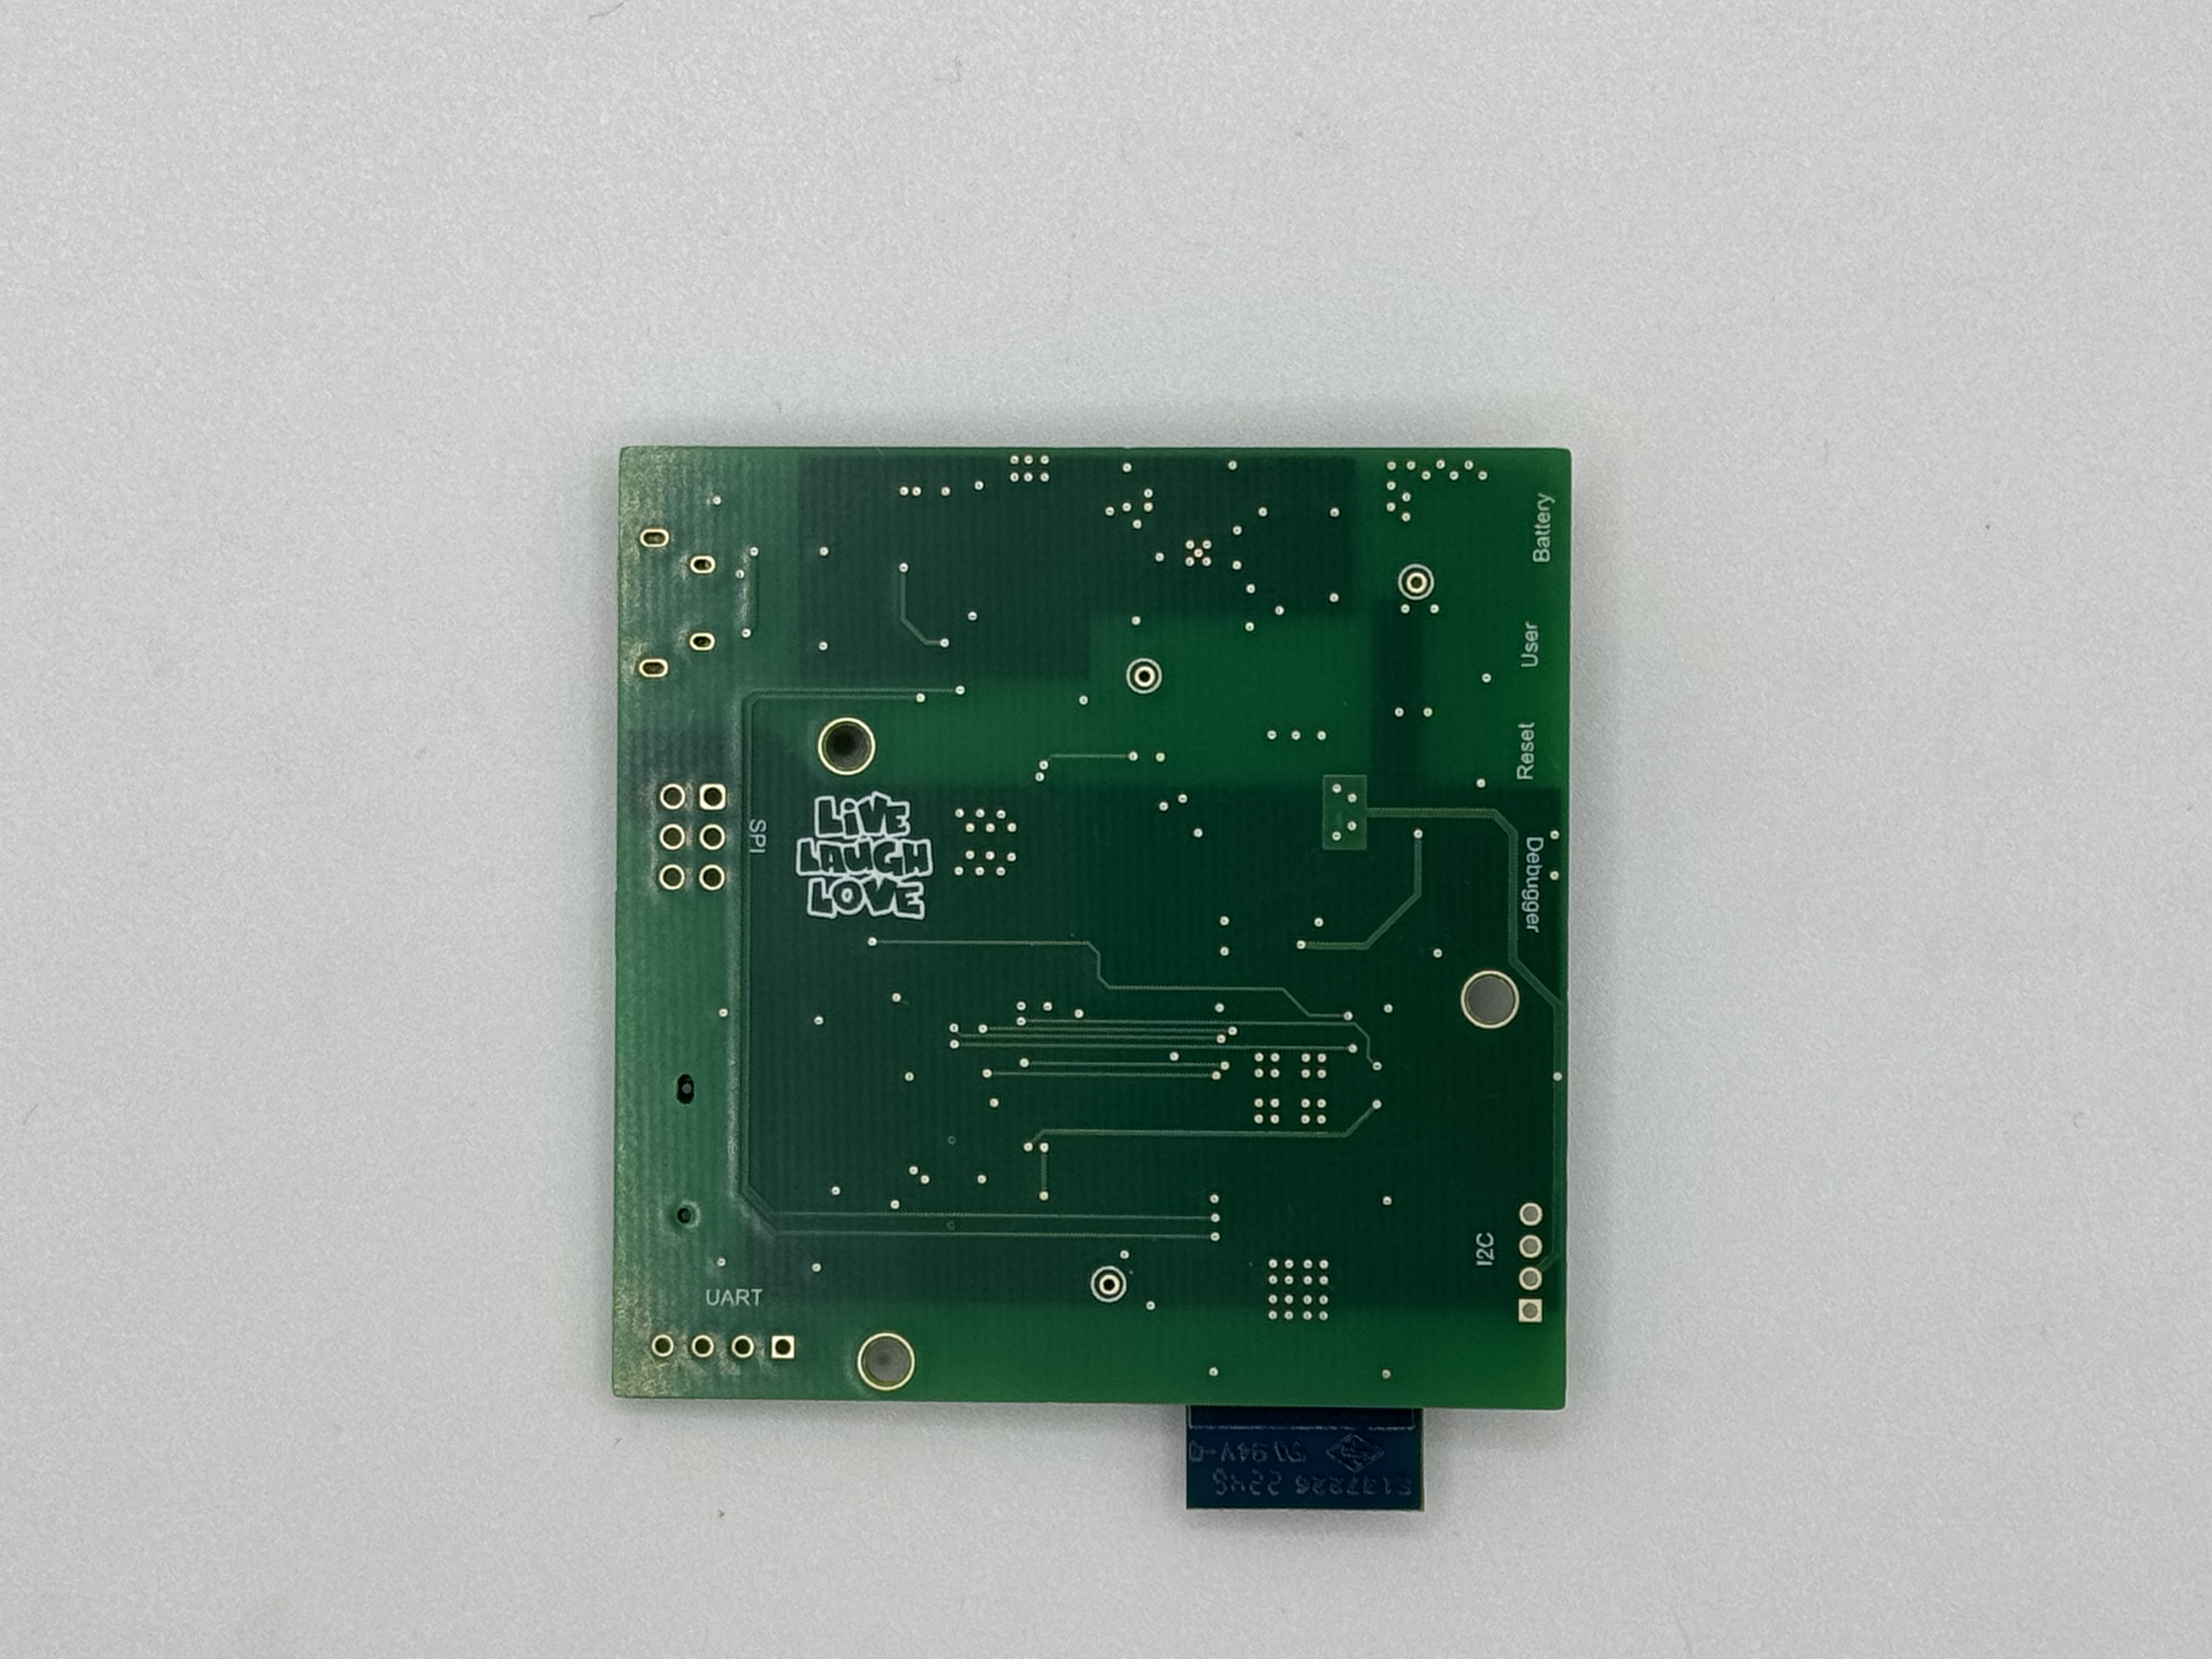 # The load was 545mA on the 3.3V regulator for the following thermal image of the PCBA: 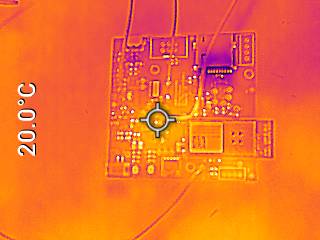 # Altium Board design 2D view: 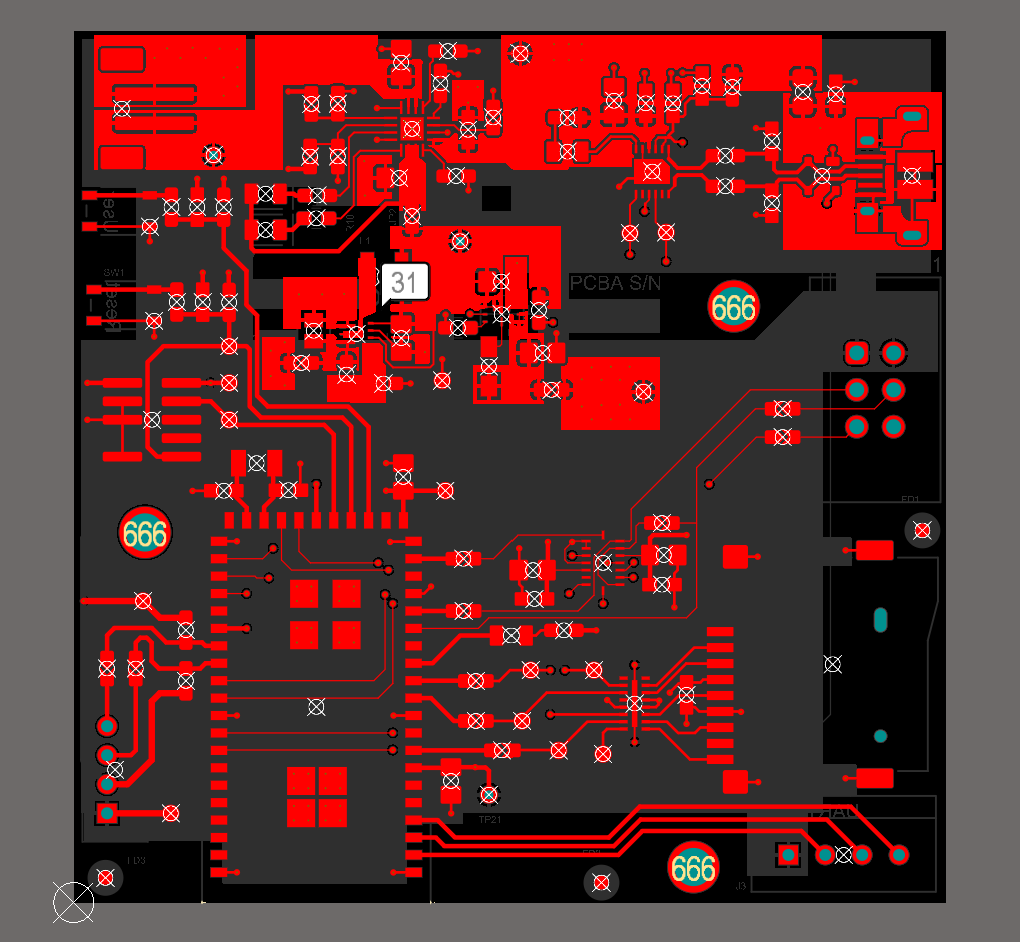 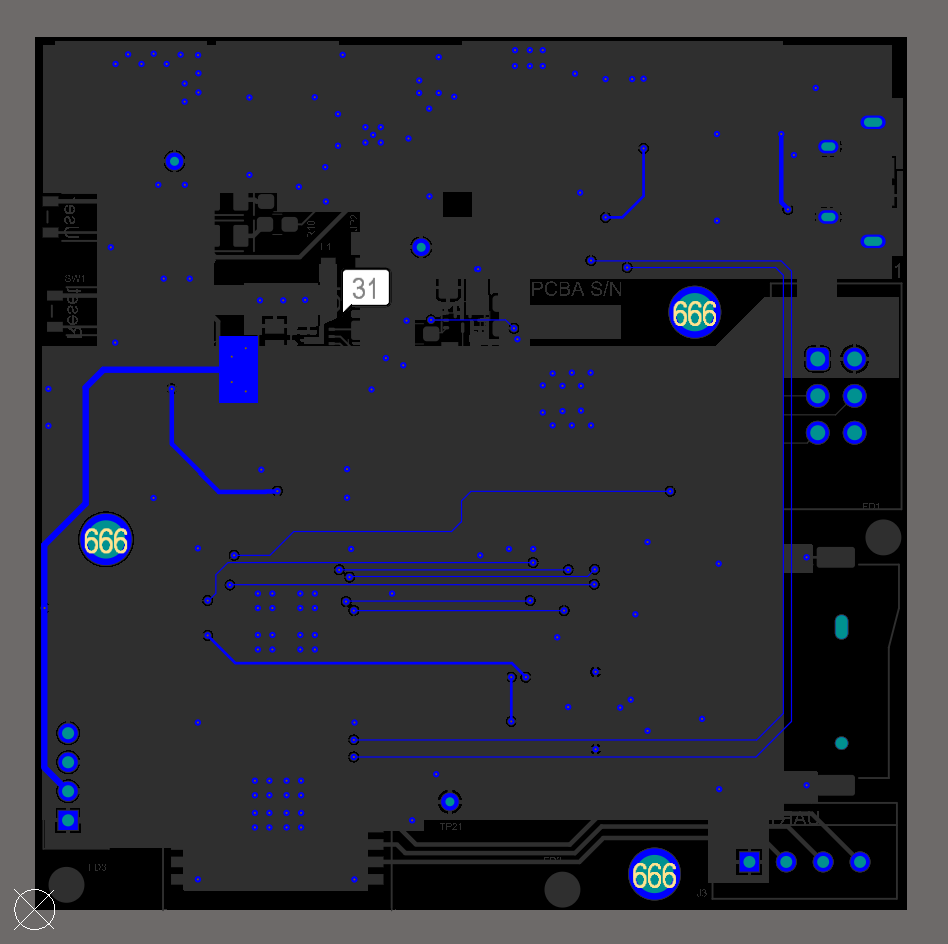 # Altium Board design 3D view: 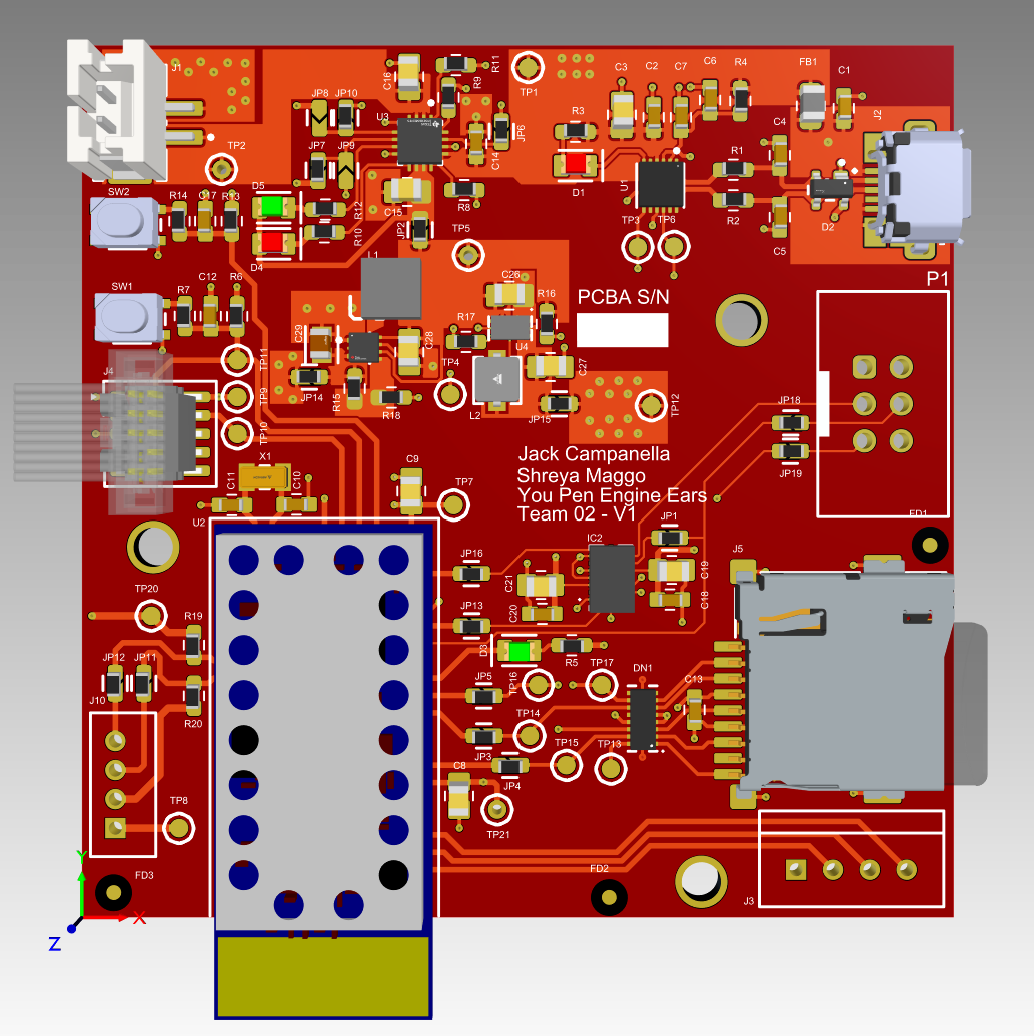 # Node-RED dashboard: 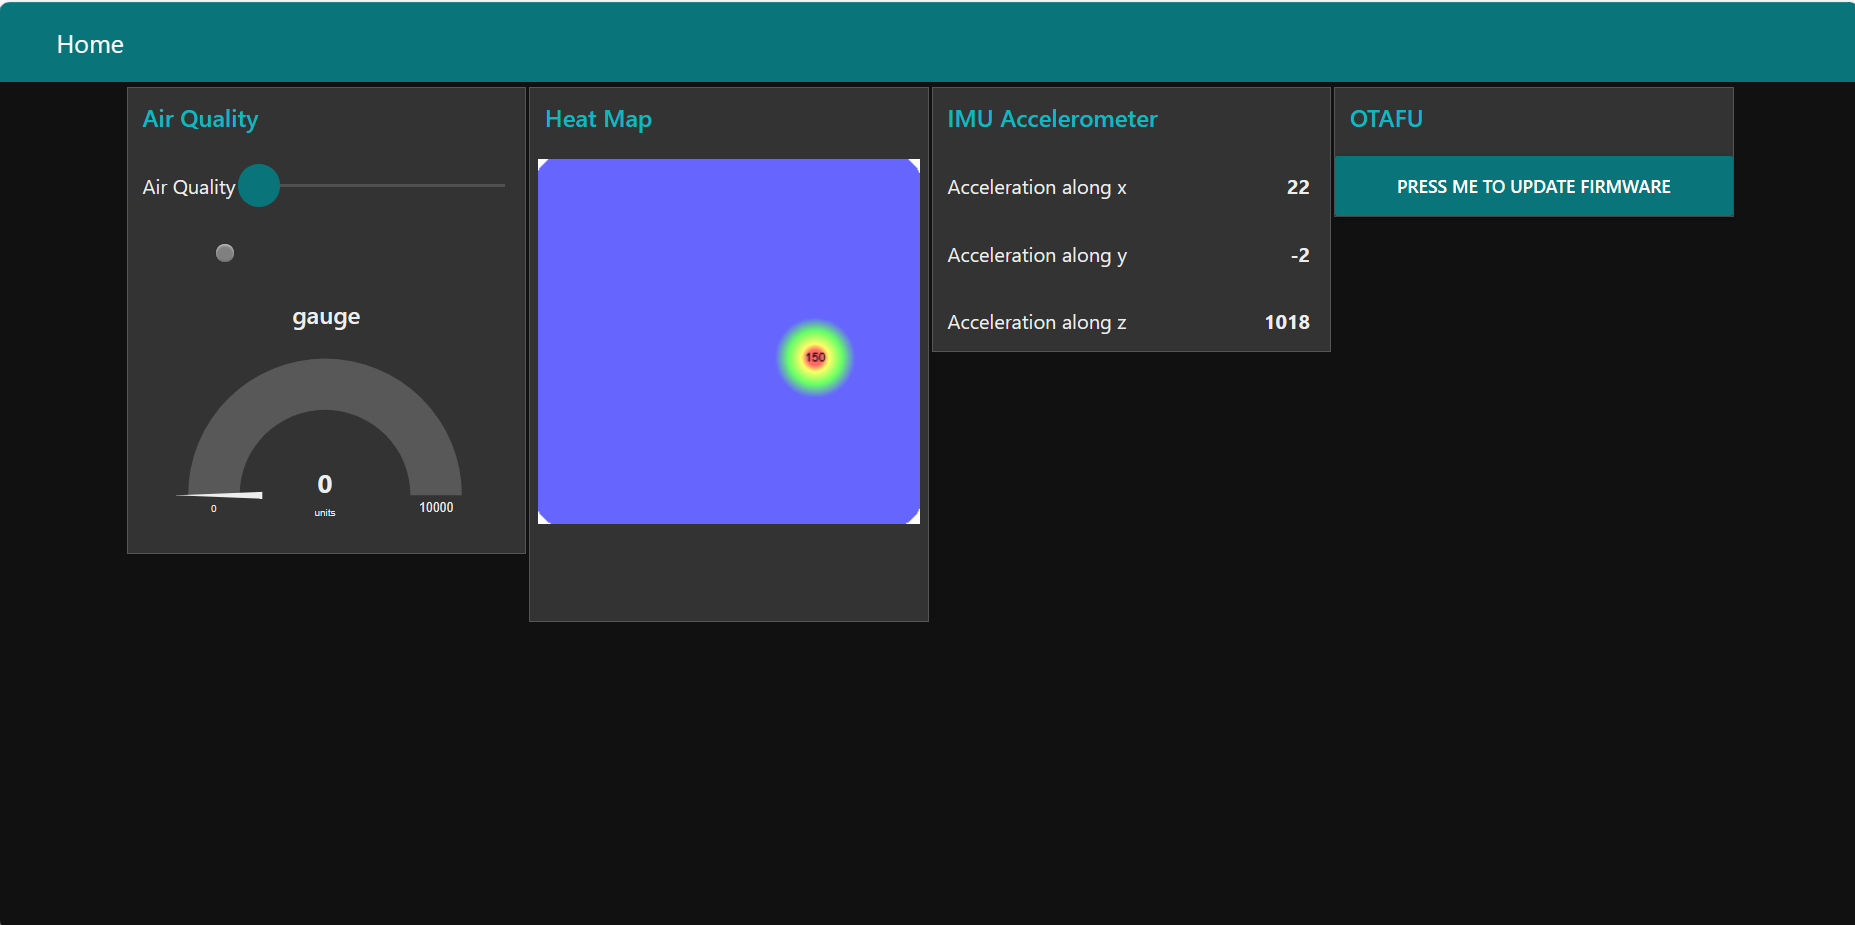 # Node-RED backend: 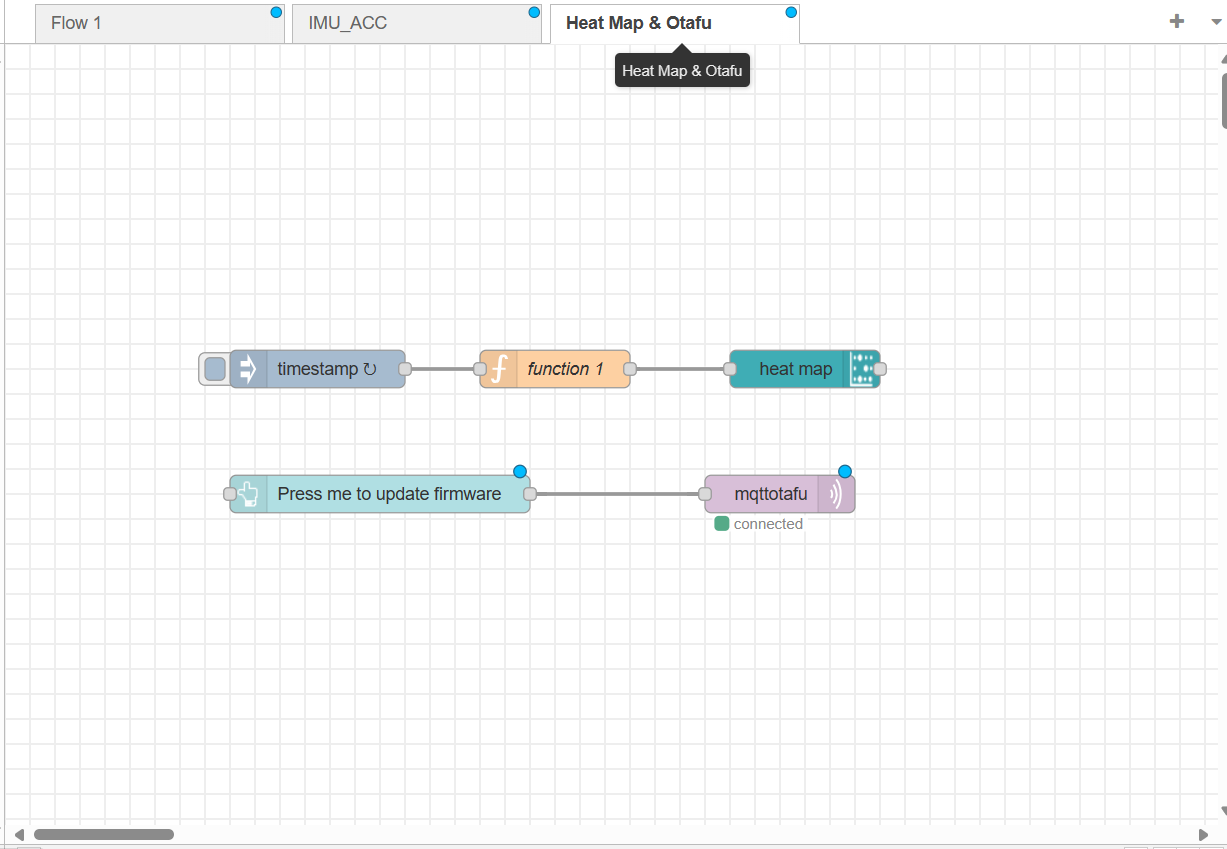 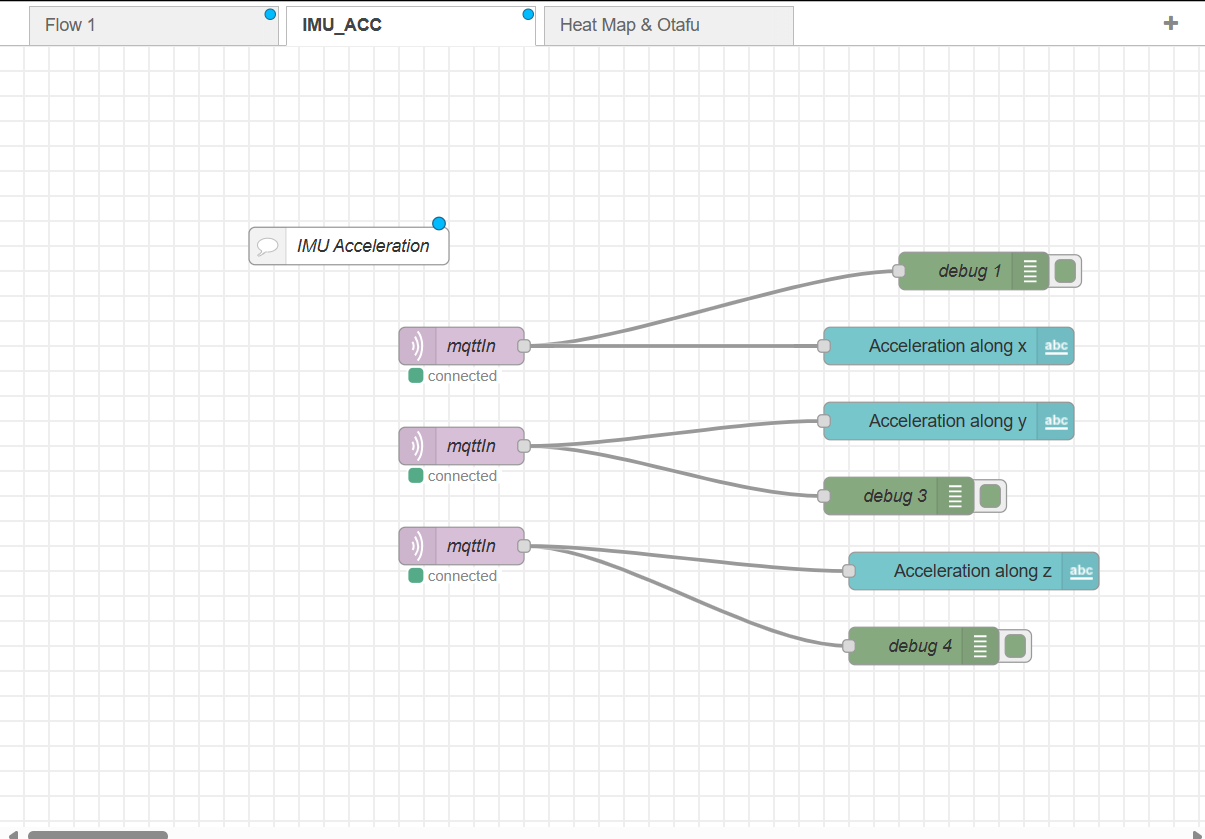 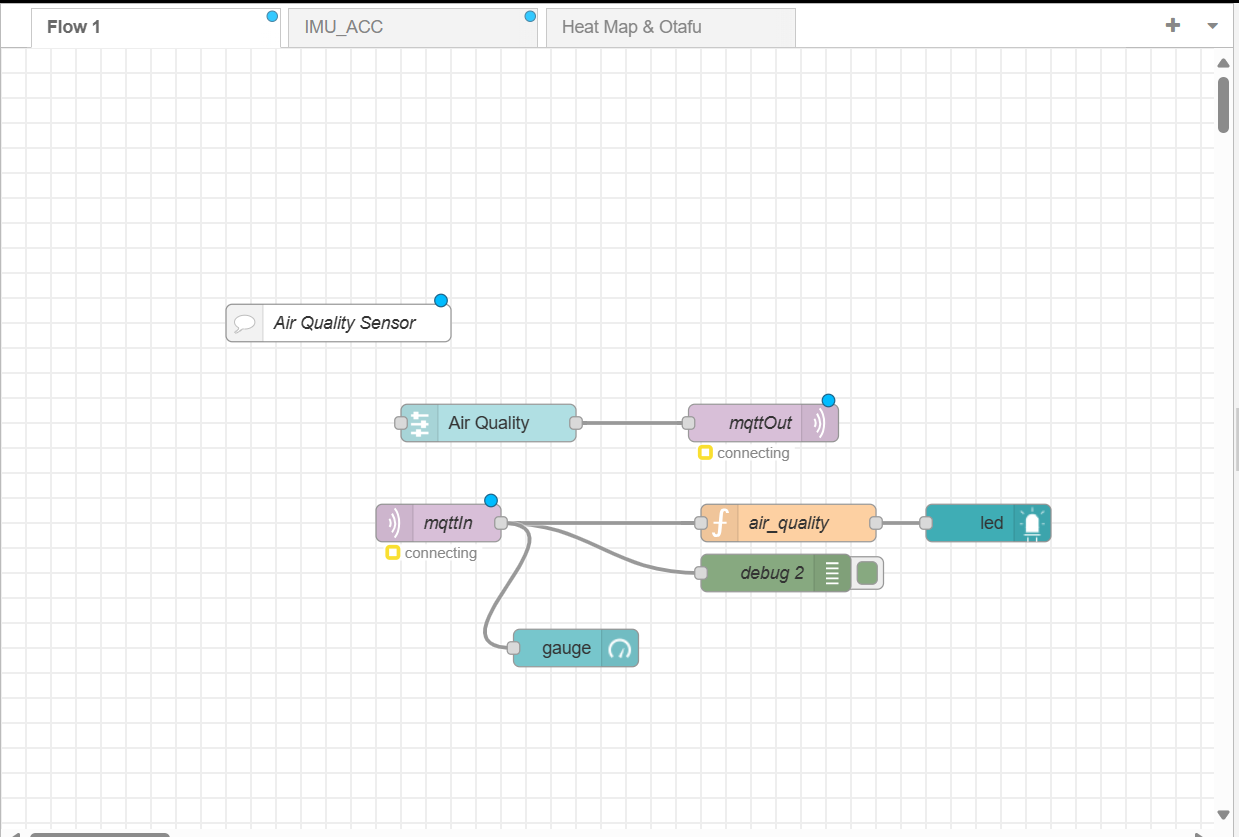 # Block diagram of system: # Simple System Diagram: 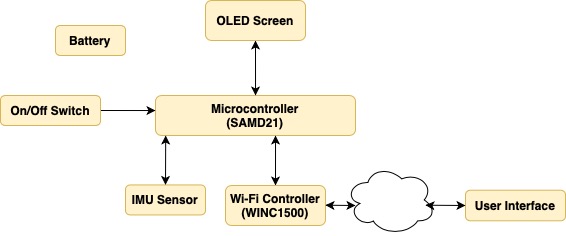 # Detailed System Diagram: